
Total visibility.
Total control.
Every market, every store, every team member.
A geographic dashboard that lets you drill from a global overview to an individual team member in a specific store. See completion rates, quiz scores, engagement patterns, and knowledge gaps across your entire organisation. In real time.
Filter by market, country, point of sale, or time range. Compare regions side by side. Identify top performers and stores that need attention. Export what you need. No waiting for quarterly reports from a separate analytics team.
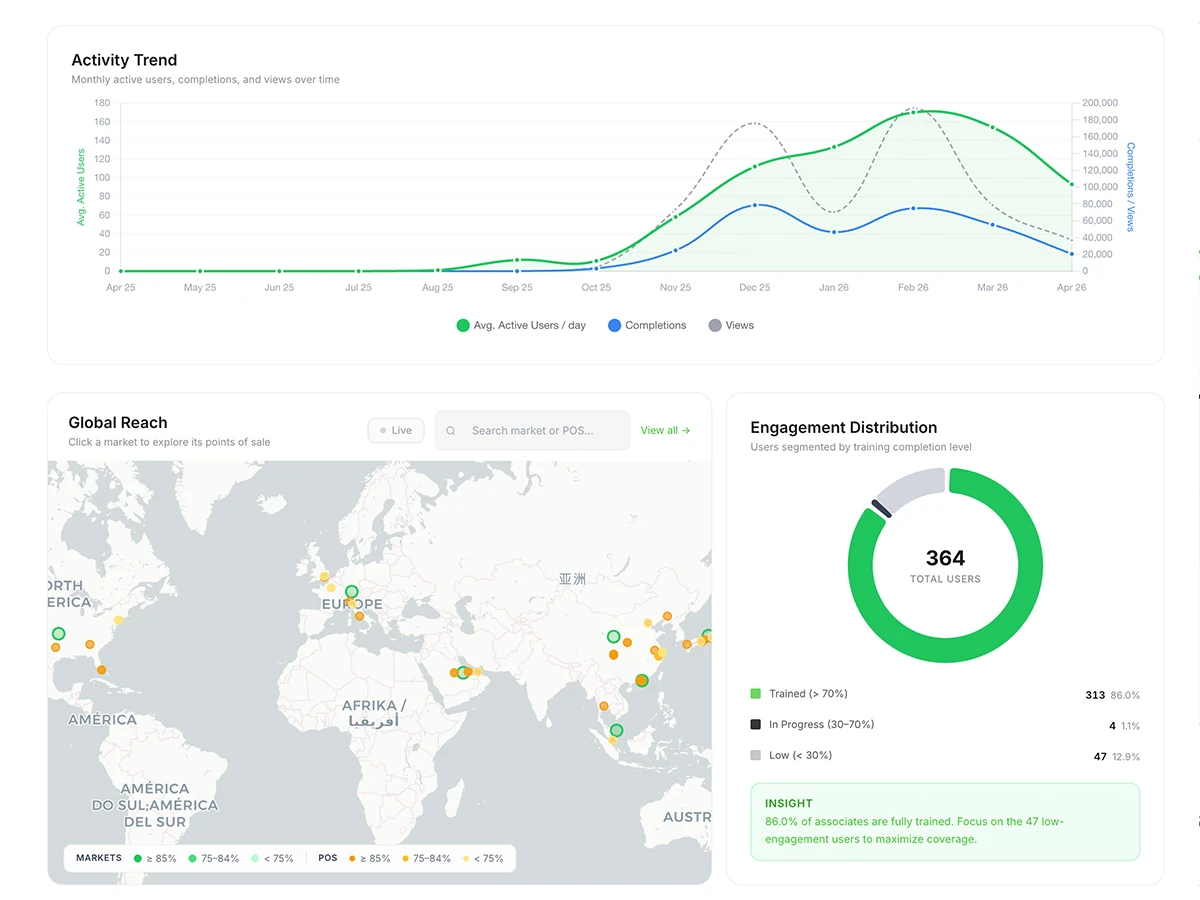
Geographic Map View
Store performance plotted on a real map. Click any location to drill into completion rates, quiz scores, and individual team member progress.
Leaderboards
Users ranked by points, completion, and scores. Filterable by market. Drive healthy competition across regions and stores.
Content Performance
See which episodes and programmes drive the best engagement and quiz results. Double down on what works, retire what does not.
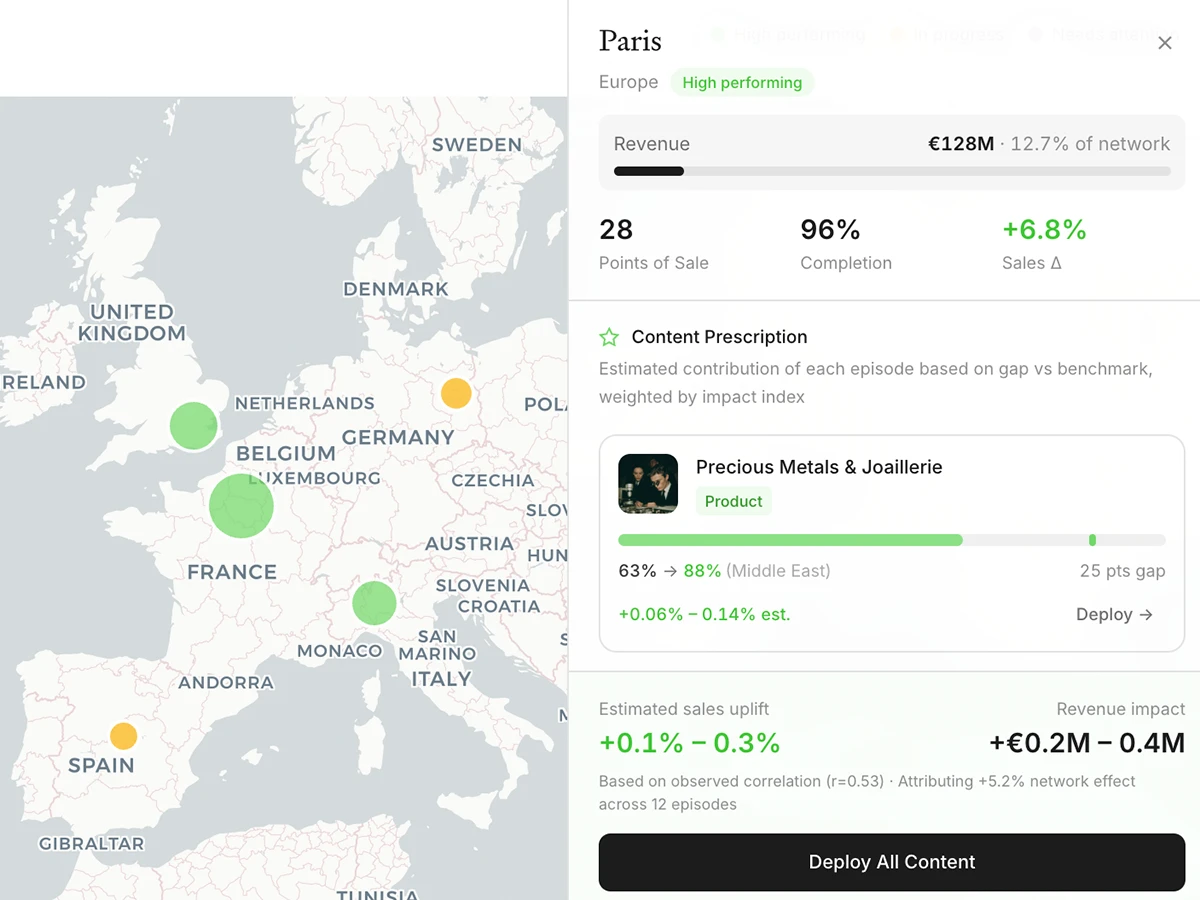
Deploy content with precision.
Target training content by market, store, product line, or individual team. Schedule publication to align with product launches and seasonal calendars. The right content reaches the right people at the right time, automatically.
The publication mix gives you explicit, weighted control over the algorithmic feed: balance learning quests, corporate communications, brand recommendations, and personalised suggestions. Different markets can have different priorities.
Algorithmic Feed Control
Weighted sliders define what your teams see: quest vs. communication, user interests vs. brand recommendations. Configurable globally and per market.
80+ Languages
Translate entire programmes in minutes. Document-level translation preserves context and tone. Video dubbing with voice selection and segment review.
AI Content Creation
Upload a brand book. AI proposes chapters, generates quizzes, and structures the programme. From raw PDF to published training in under 30 minutes.
Prove the return on training.
Cross-lag correlation analysis links training activity to sales outcomes. You see not just who completed the training, but how completion moved the numbers in the following weeks, store by store, product by product.
The content impact index reveals which specific programmes drive the most commercial results. Justify budget allocation with data, not intuition. Training is no longer a cost centre. It is a revenue driver you can measure.
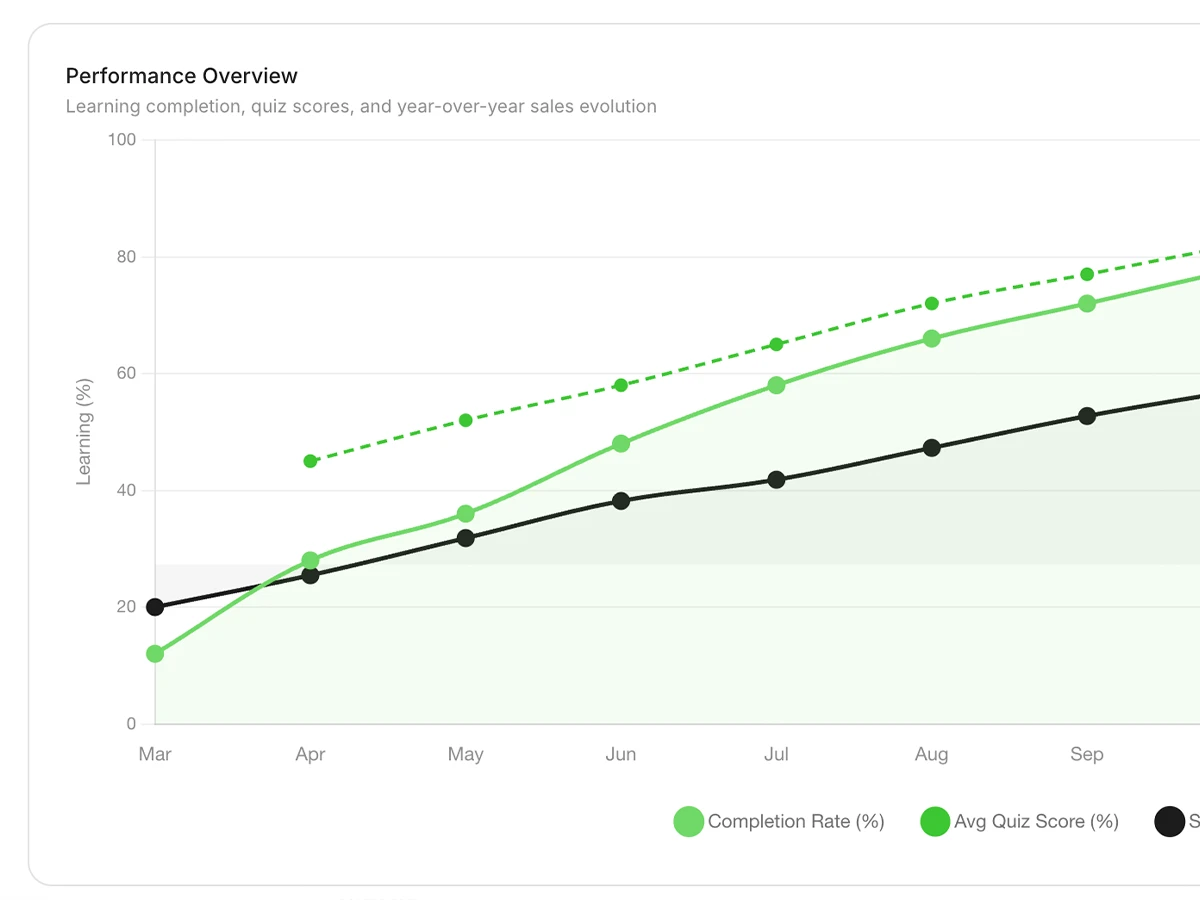
Training-to-Sales Correlation
Statistical analysis at different time lags reveals when training impact peaks on sales. Typically one month post-completion.
Content Impact Index
Per-programme metric correlating training completion to product sales. See which content moves the business and which needs rethinking.
Trend Intelligence
Consumer insights, sentiment analysis, and search analytics. Understand what your customers are saying and align training accordingly.
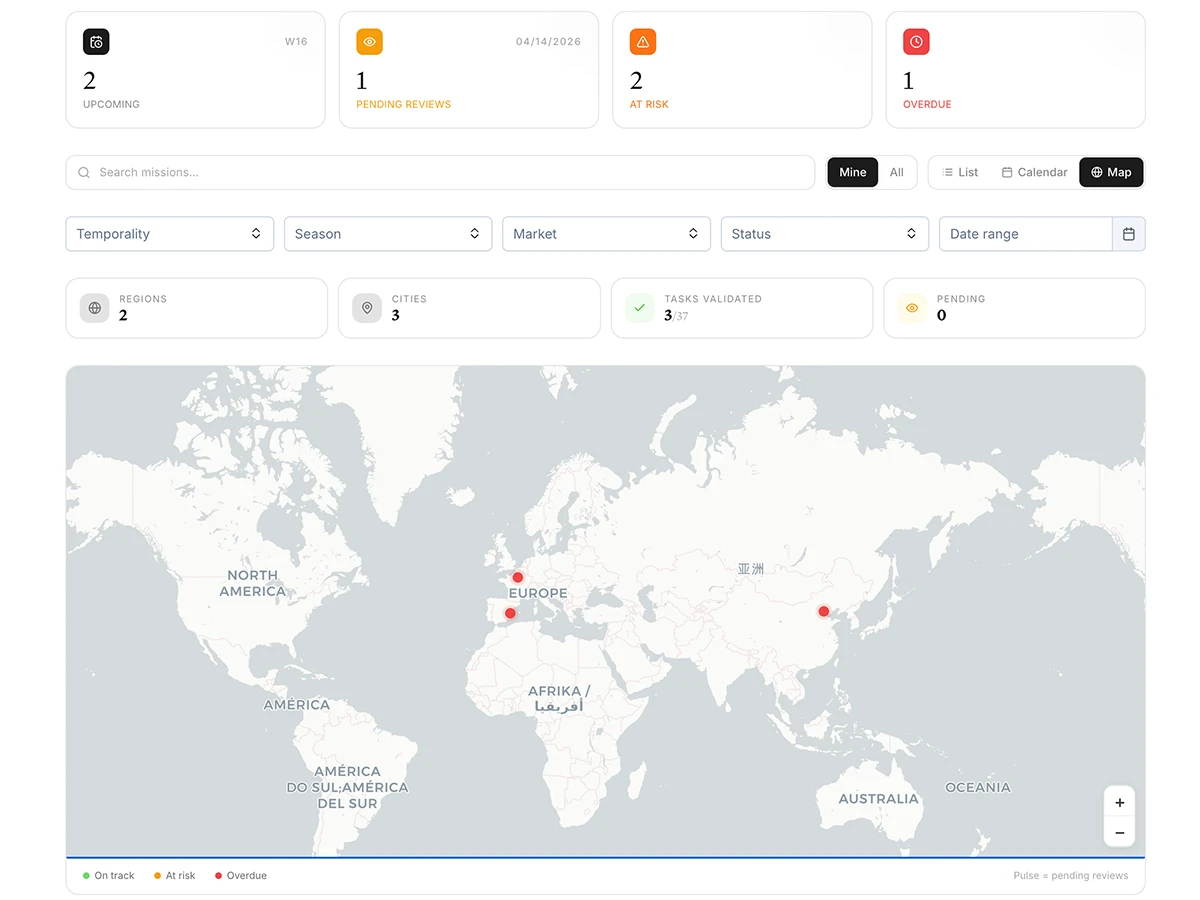
Visual merchandising and workforce, centralised.
VM missions are created at HQ, assigned to stores, and tracked through a compliance dashboard showing which locations are on time, at risk, or overdue. AI analyses submitted photos against your brand guidelines automatically.
Workforce management (scheduling, time tracking, absence management, shift trading) runs natively in the same platform. One operational hub for training, merchandising, and staffing. No more tool sprawl.